This version is outdated by a newer approved version. This version (2017/03/17 14:09) is a draft.
Approvals: 0/1
 This version (2017/03/17 14:09) is a draft.
Approvals: 0/1
This is an old revision of the document!
Monitor where threads/processes are running
There are several ways to monitor your job, either in live time directly on the compute node or by modifying the job script or the application code:
- live ⟿ submit the job and connect with the compute node
[xy@l32]$ sbatch job.sh
[xy@l32]$ squeue -u xy
JOBID    PARTITION  NAME      USER  ST  TIME  NODES  NODELIST(REASON)
5066692  mem_0064   nn1tn8th   xy   R   0:02    1    n09-005
[xy@l32]$ ssh n09-005
[xy@n09-005]$ top
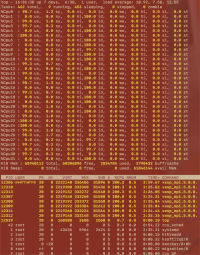
When typing ⟿ 1 during the top call, per-core-information is obtained, e.g., about the cpu-usage, compare with the picture to the right. The user can select the parameters to be shown from a list displayed when typing ⟿ f.
The columns VIRT and RES indicate the virtual, resident memory usage of each process (per default in kB).
- batch script (Intel-MPI) ⟿ set: I_MPI_DEBUG=4
- code ⟿ via library functions information about the locality of processes and threads can be obtained (libraries: mpi.h or in C-code hwloc.h (hardware locality) or sched.h (scheduling parameters))
#include "mpi.h"
...
MPI_Get_processor_name(processor_name, &namelen);
#include <sched.h>
...
CPU_ID = sched_getcpu();
#include <hwloc.h>
...
    hwloc_topology_t topology;
    hwloc_cpuset_t cpuset;
    hwloc_obj_t obj;
    hwloc_topology_init ( &topology);
    hwloc_topology_load ( topology);
    hwloc_bitmap_t set = hwloc_bitmap_alloc();
    hwloc_obj_t pu;
    err = hwloc_get_proc_cpubind(topology, getpid(), set, HWLOC_CPUBIND_PROCESS);
    pu = hwloc_get_pu_obj_by_os_index(topology, hwloc_bitmap_first(set));
    int my_coreid = hwloc_bitmap_first(set);
    hwloc_bitmap_free(set);
    hwloc_topology_destroy(topology);

//  compile: mpiicc -qopenmp -o ompMpiCoreIds ompMpiCoreIds.c -lhwloc
