 This version (2022/06/23 13:16) was approved by msiegel.The Previously approved version (2022/06/23 08:30) is available.
This is an old revision of the document!
Monitoring Processes & Threads
CPU Load
There are several ways to monitor the threads CPU load distribution of your job, either live directly on the compute node, or by modifying the ], or the [[doku:monitoring#Application code.
Live
So we assume your program runs, but could it be faster? SLURM gives you
a Job ID, type squeue –job myjobid to find out on which node your
job runs; say n372-007. Type ssh n372-007, to connect to the given
node. Type top to start a simple task manager:
[myuser@l32]$ sbatch job.sh
[myuser@l32]$ squeue -u myuser
JOBID    PARTITION  NAME      USER    ST  TIME  NODES  NODELIST(REASON)
1098917  mem_0096   gmx_mpi   myuser  R   0:02   1     n372-007
[myuser@l32]$ ssh n372-007
[myuser@n372-007]$ top
Within top, hit the following keys (case sensitive): H t 1. Now you
should be able to see the load on all the available CPUs, as an
example:
top - 16:31:51 up 181 days,  1:04,  3 users,  load average: 1.67, 3.39, 3.61
Threads: 239 total,   2 running, 237 sleeping,   0 stopped,   0 zombie
%Cpu0  :  69.8/29.2   99[|||||||||||||||||||||||||||||||||||||||||||||||| ]
%Cpu1  :  97.0/2.3    99[|||||||||||||||||||||||||||||||||||||||||||||||| ]
%Cpu2  :  98.7/0.7    99[|||||||||||||||||||||||||||||||||||||||||||||||| ]
%Cpu3  :  95.7/4.0   100[|||||||||||||||||||||||||||||||||||||||||||||||| ]
%Cpu4  :  99.0/0.3    99[|||||||||||||||||||||||||||||||||||||||||||||||| ]
%Cpu5  :  98.7/0.3    99[|||||||||||||||||||||||||||||||||||||||||||||||| ]
%Cpu6  :  99.3/0.0    99[|||||||||||||||||||||||||||||||||||||||||||||||||]
%Cpu7  :  99.0/0.0    99[|||||||||||||||||||||||||||||||||||||||||||||||| ]
KiB Mem : 65861076 total, 60442504 free,  1039244 used,  4379328 buff/cache
KiB Swap:        0 total,        0 free,        0 used. 62613824 avail Mem

  PID USER      PR  NI    VIRT    RES    SHR S %CPU %MEM     TIME+ COMMAND
18876 myuser    20   0 9950.2m 303908 156512 S 99.3  0.5   0:11.14 gmx_mpi
18856 myuser    20   0 9950.2m 303908 156512 S 99.0  0.5   0:12.28 gmx_mpi
18870 myuser    20   0 9950.2m 303908 156512 R 99.0  0.5   0:11.20 gmx_mpi
18874 myuser    20   0 9950.2m 303908 156512 S 99.0  0.5   0:11.25 gmx_mpi
18872 myuser    20   0 9950.2m 303908 156512 S 98.7  0.5   0:11.19 gmx_mpi
18873 myuser    20   0 9950.2m 303908 156512 S 98.7  0.5   0:11.15 gmx_mpi
18871 myuser    20   0 9950.2m 303908 156512 S 96.3  0.5   0:11.09 gmx_mpi
18875 myuser    20   0 9950.2m 303908 156512 S 95.7  0.5   0:11.02 gmx_mpi
18810 root      20   0       0      0      0 S  6.6  0.0   0:00.70 nv_queue
...
In our example all 8 threads are utilised; which is good. The opposite is not true however, sometimes the best case still only uses 40% on most CPUs!
The columns VIRT and RES indicate the virtual, respective
resident memory usage of each process (unless noted otherwise in
kB). The column COMMAND lists the name of the command or
application.
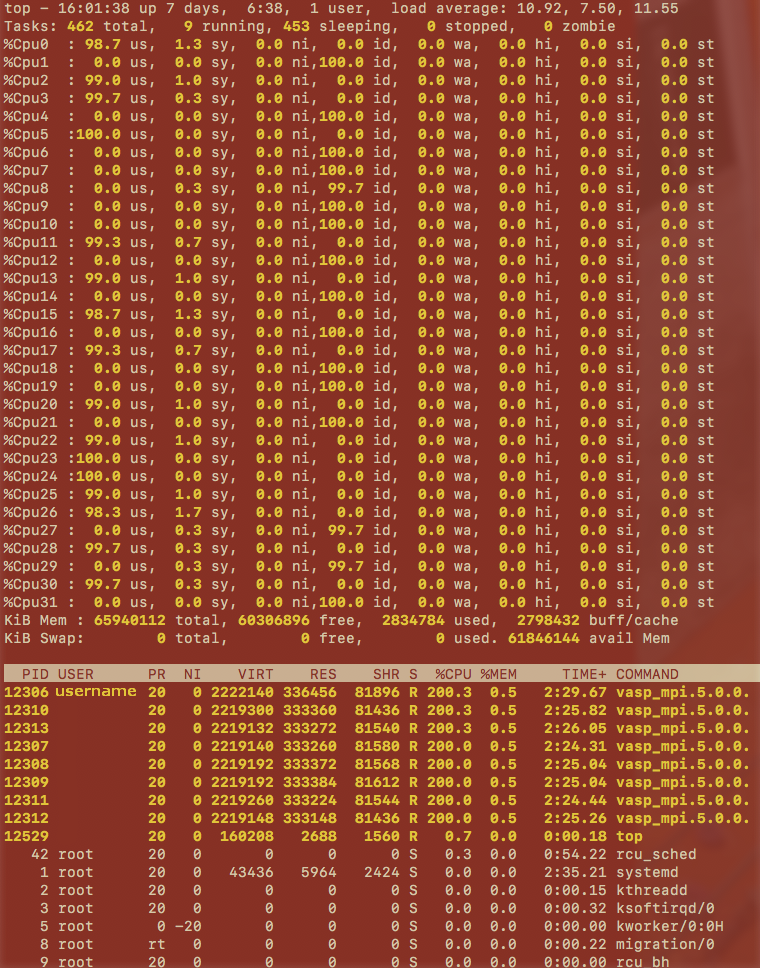
In the following screenshot we can see stats for all 32 threads of a compute node running VASP:
Job Script
If you are using Intel-MPI you might include this option in your batch script:
I_MPI_DEBUG=4
Application Code
If your application code is in C, information about the locality of
processes and threads can be obtained via library functions using either
of the following libraries:
mpi.h
#include "mpi.h"
...  MPI_Get_processor_name(processor_name, &namelen);
sched.h (scheduling parameters)
#include <sched.h>
...  CPU_ID = sched_getcpu();
hwloc.h (Hardware locality)
#include <hwloc.h>
...
    hwloc_topology_t topology;
    hwloc_cpuset_t cpuset;
    hwloc_obj_t obj;
    hwloc_topology_init ( &topology);
    hwloc_topology_load ( topology);
    hwloc_bitmap_t set = hwloc_bitmap_alloc();
    hwloc_obj_t pu;
    err = hwloc_get_proc_cpubind(topology, getpid(), set, HWLOC_CPUBIND_PROCESS);
    pu = hwloc_get_pu_obj_by_os_index(topology, hwloc_bitmap_first(set));
    int my_coreid = hwloc_bitmap_first(set);
    hwloc_bitmap_free(set);
    hwloc_topology_destroy(topology);

//  compile: mpiicc -qopenmp -o ompMpiCoreIds ompMpiCoreIds.c -lhwloc
GPU Load
We assume you program uses a GPU, and your program runs as expected,
so could it be faster? On the same node where your job runs (see CPU
load section), maybe in a new terminal, type watch nvidia-smi, to
start a simple task manager for the graphics card. watch just
repeats a command every 2 seconds, acts as a live monitor for the
GPU. In our example below the GPU utilisation is around 80% the most
time, which is very good already.
Every 2.0s: nvidia-smi                                 Wed Jun 22 16:42:52 2022
Wed Jun 22 16:42:52 2022
+-----------------------------------------------------------------------------+
| NVIDIA-SMI 460.32.03    Driver Version: 460.32.03    CUDA Version: 11.2     |
|-------------------------------+----------------------+----------------------+
| GPU  Name        Persistence-M| Bus-Id        Disp.A | Volatile Uncorr. ECC |
| Fan  Temp  Perf  Pwr:Usage/Cap|         Memory-Usage | GPU-Util  Compute M. |
|                               |                      |               MIG M. |
|===============================+======================+======================|
|   0  GeForce GTX 1080    Off  | 00000000:02:00.0 Off |                  N/A |
| 36%   59C    P2   112W / 180W |    161MiB /  8119MiB |     83%      Default |
|                               |                      |                  N/A |
+-------------------------------+----------------------+----------------------+

+-----------------------------------------------------------------------------+
| Processes:                                                                  |
|  GPU   GI   CI        PID   Type   Process name                  GPU Memory |
|        ID   ID                                                   Usage      |
|=============================================================================|
|    0   N/A  N/A     21045      C   gmx_mpi                           159MiB |
+-----------------------------------------------------------------------------+
